Statistical process control (SPC) is not an easy subject to explain however, with LogBook Monitor, determining if a machine or sample is in control is simple. Color coded symbols quickly tell you if you are statistically in control of your process.
Key Features
Simplified real-time SPC monitoring.
Visual indicators to see what is statistically in or out of control
Select the tests you want (i.e. Weight, strength, etc.)
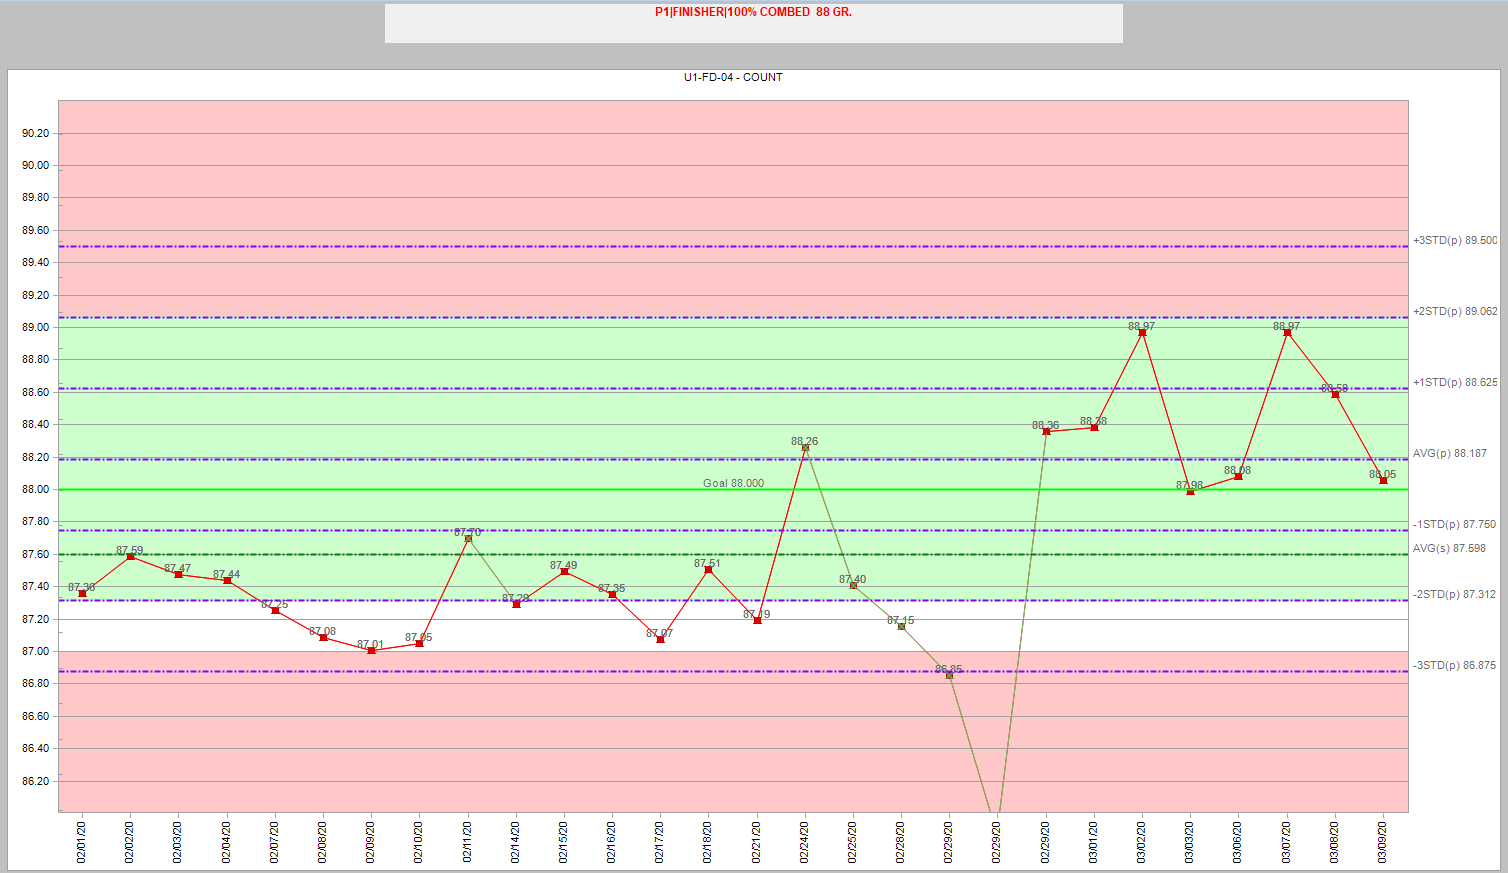
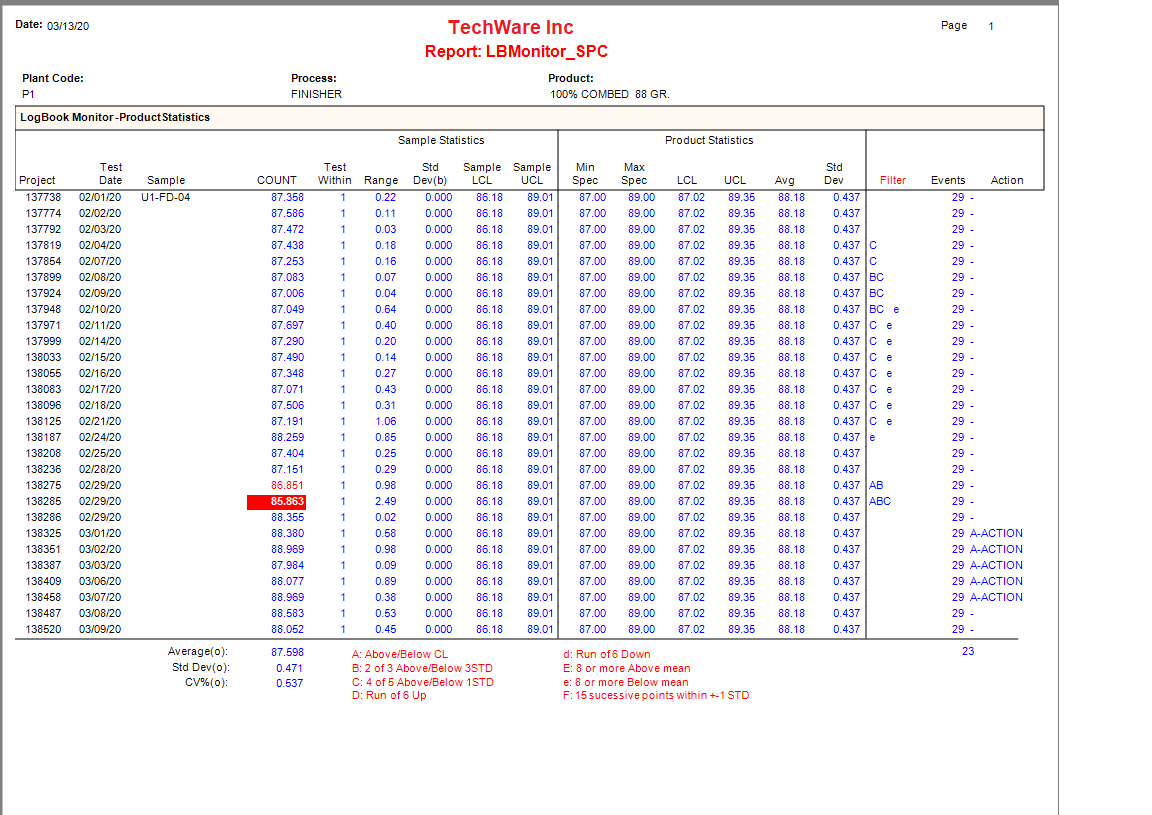
Reports and charts based on 6 key statistical fundamentals.
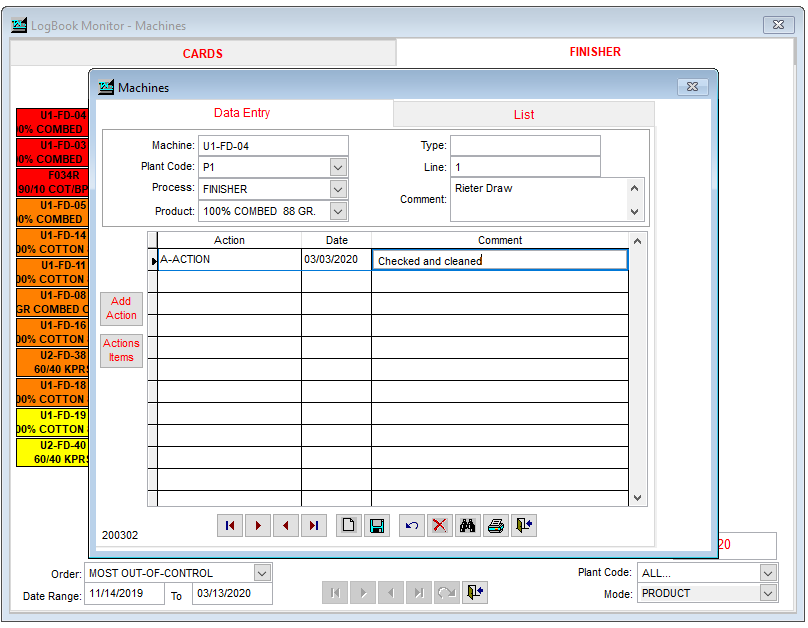
Pin Point / Find Problems: Find quality problems and correct them before they become costly.
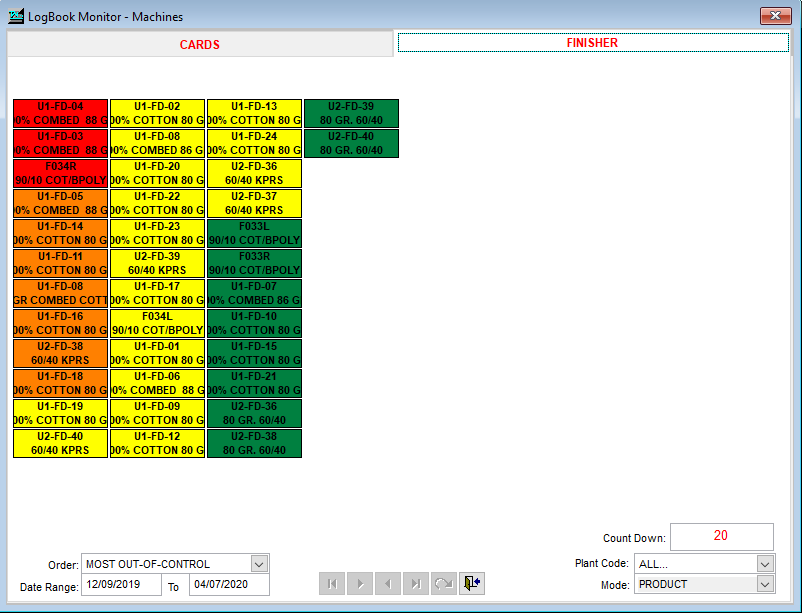
Real time SPC monitoring with LogBook Monitor
Visually see what machines and products are in or out of control
Statistics are not always easy to understand however, most people know that red means stop, yellow means caution and green means your good to go. This was the approach in designing LogBook Monitor.
Out of Control Conditions
Condition “A” – if one or more points fall outside of the upper or lower control limits. Normally these limits are +- 3 standard deviations from the mean.
Condition “B” – if two of three successive points fall beyond two standard deviations from the mean.
Condition “C” – if four of five successive points fall beyond one standard deviations from the mean.
Condition “D” – if there is a “run” of six or more point that are successively higher or lower.
Condition “E” – if eight or more points fall on either side of the mean.
Condition “F” – if 15 consecutive points fall 1 standard deviation on either side of the mean.