
What is Statistical process control (SPC)?
According to Wikipedia, the pioneer of SPC was Walter A. Shewhart who worked at Bell Laboratories way back in 1920’s. Basically SPC is a method of quality control which employs statistical methods to monitor and control a process. LogBook Discovery is a application that collects data from manufacturing processes, so it makes sense to include SPC as part of our overall package. For this reason, LogBook Monitor was created to make SPC more simple to understand.
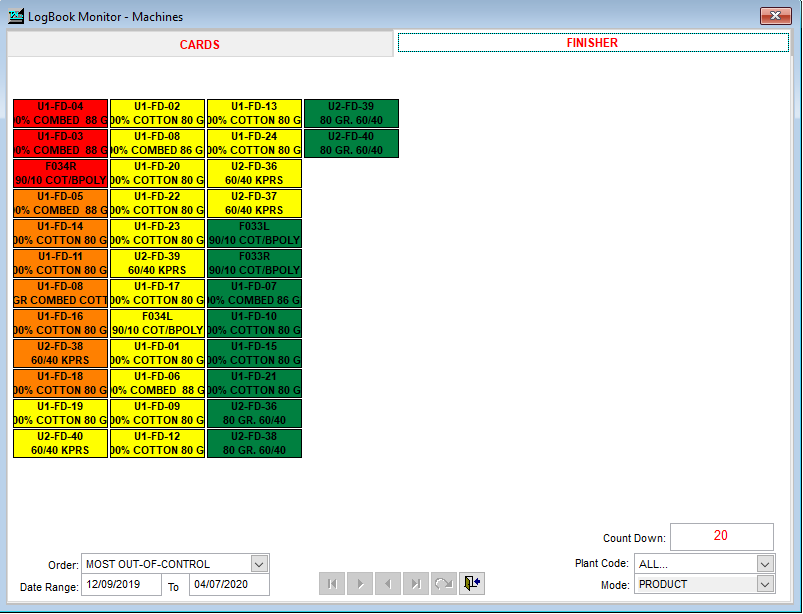
LogBook Monitor is an application used in conjunction with LogBook Discovery. It uses colors to indicate when a machine is statistically out of control!
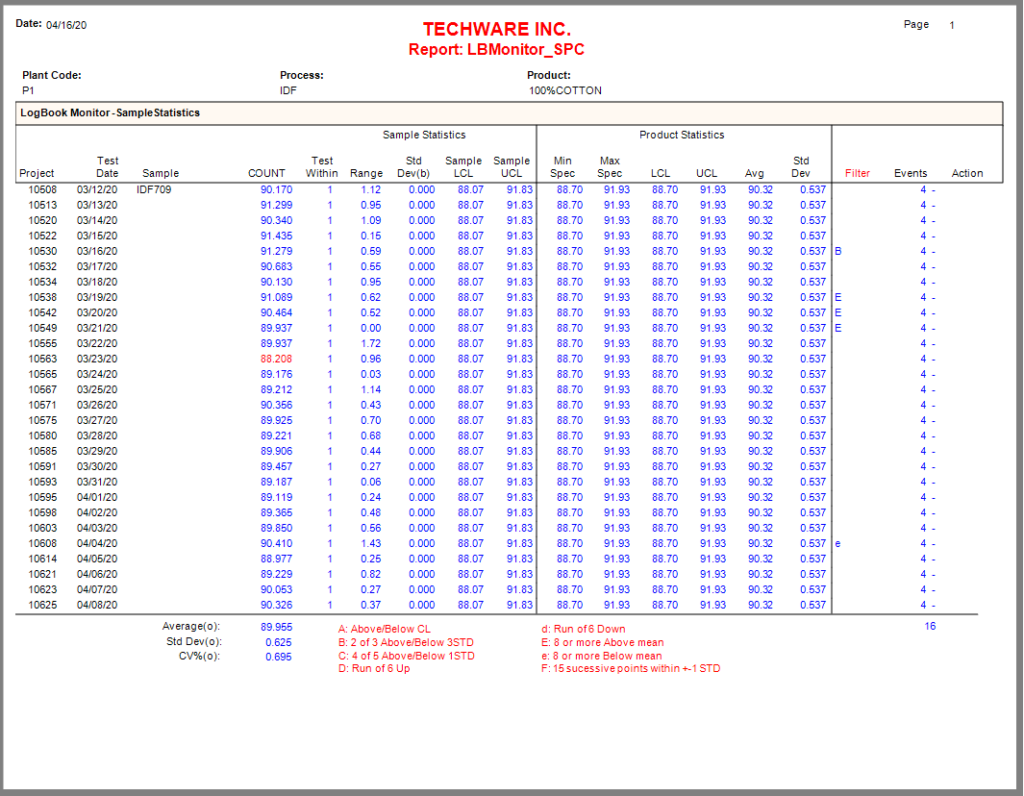
Select a symbol with a simple click to see the results. Below are the last 28 values for a test called “Count”. There are four events for the sample – Condition “B” which says that there are 2 of 3 values above or below 3 standard deviations from the mean. Next is Condition “E” that occurs when there are 8 or more values above the mean. And finally Condition “e” which occurs when there are 8 or more values below the mean.
As you have always heard, a picture is worth a thousand words. Well below is the same data represented graphically in a control chart.
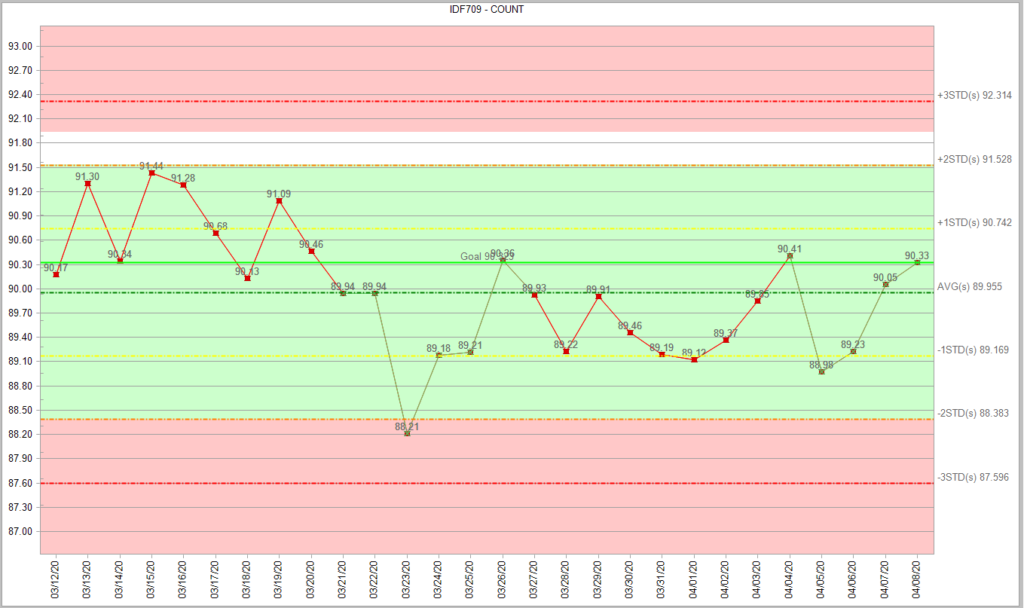
Based on this information, it looks as though a change in the process was made around 3/20 which caused the process to move in a different direction.
If you need a quality control application that can automate your data collection and implement statistical process control, give us a call!